Decrement indices have been purposely designed with structured products in mind. What the decrement feature offers is reduced uncertainty of hedging future dividends for the structured product issuer by instead fixing the dividend, and therefore reducing costs.
When banks issue a structured product that uses an underlying that does not include dividend income (like the FTSE 100), they must forecast a projected dividend and hedge out this projection using futures and options, which increase the costs and risks for the issuer. However, if the dividend for the underlying in a structured product is fixed then the bank will experience reduced costs and uncertainty from hedging the dividend, leading to improved product terms for the investor.
What is a decrement index?
Most equity indices come in two forms, price and total return. A price index, such as the FTSE 100, is an index which uses the market prices of the constituent securities, but excludes dividends paid by the securities. A total return index on the other hand, such as DAX, includes any dividends paid to investors holding the securities within the index.
The decrement index is a so-called synthetic index, which aims to replicate the returns of the equivalent total return index. The difference is that the synthetic index deducts a pre-fixed annual dividend (known as a “decrement”) on a rolling basis from the replicated total return index price.
Let’s look at few different FTSE 100 indices as an example.
• The value of the FTSE 100 price index is determined by the market prices of the securities forming the index excluding any dividends paid by these securities.
• The valued of the FTSE 100 Total Return Index is determined by the market prices of the securities forming the index, plus the dividends paid by these securities.
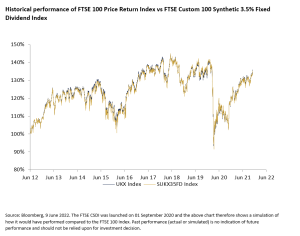
• The value of the FTSE Custom 100 Synthetic 3.5% Fixed Dividend Index (FTSE CSDI) takes the level of the FTSE 100 Synthetic Index (which has returns similar to that of the FTSE 100 Total Return Index), and then subtracts a fixed annualised 3.5% dividend (decrement) from the index level on a rolling daily basis.
Benefit to Issuers and Clients?
The advantage for the issuers is obvious: as the synthetic dividend is agreed in advance, there is no dividend risk for the issuer. Only the volatility risk remains.
By selling a structured product based on a total return index with a decrement, the issuer eliminates the unpredictability of dividends and is protected against any dividend shortfalls.
The reduced risk for the issuer can mean better terms for the investor on a synthetic index, which is designed to closely replicate the benchmark index.
This also allows banks to issue notes with longer maturities that may be more appropriate for long term investors.
Risks of decrement indices
The decrement index is not the same as the benchmark. While its performance is expected to be similar, it will not be identical. It is possible that the benchmark could rise while the decrement index falls.
Whilst the decrement indices can help to reduce uncertainty, the potential disadvantage to the investor is that the decrement index may underperform the total return or price index during periods of market distress; when dividends are likely to be reduced or stopped.
Sometimes decrements can also be set at much higher levels than the historical dividends of the underlying. This may help to increase the potential coupon (return) to the investor, but it also increases risk of underperformance (of the decrement index compared to the price index).
Closer look at correlation and past performance
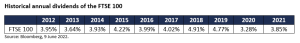
If we look at the historical dividends of the FTSE 100 over the past 10 years and compare it to the FTSE CSDI (which subtracts a fixed annualised 3.5% “dividend”), this fixed dividend has largely worked in investors’ favour. This is because it has been lower than the annual dividend of the FTSE 100 in nine of the past ten years.
Historical annual dividends of the FTSE 100
Summary
Decrement indices are an effective tool for issuers to use as underlyings on structured products. Lower costs and risks for the issuer translates to improved terms for investors.
The risk of the decrement exceeding the annual dividend, resulting in potential underperformance is the core risk of using these indices. However, in return the investor should receive enhanced terms for bearing this risk.
The level of the decrement is key: setting it too high will likely result in underperformance versus the benchmark. The decrement level is typically set at around the historical implied dividend yield of the index.
Important Information
The FTSE CSDI is not seeking to replicate the FTSE 100 index. Instead, it’s an alternative that is expected to perform in a similar way, but which is appropriately designed as an underlying for structured products. You can find out more about the FTSE CSDI, including performance factsheets and daily index levels, at www.ftserussell.com/index.
This publication is intended to be Causeway Securities Limited own commentary on markets. It is not investment research and should not be construed as an offer or solicitation to buy, sell or trade in any of the investments, sectors or asset classes mentioned. The value of any investment and the income arising from it is not guaranteed and can fall as well as rise, so that you may not get back the amount you originally invested. Past performance is not a reliable indicator of future results. Movements in exchange rates can have an adverse effect on the value, price or income of any non-sterling denominated investment. Nothing in this document constitutes advice to undertake a transaction, and if you require professional advice you should contact your financial adviser.
Causeway Securities Limited is authorised and regulated by the Financial Conduct Authority. (FCA FRN 749440). Causeway Securities Limited is registered in England and Wales with company number 10102661. Registered address 2nd Floor 1 – 2 Broadgate Circle, London, England, EC2M 2QS.

In other news…
Understanding averaging: How does averaging work and why is it used in some structured products?
Quarterly averaging